Overview statistics
The Overview page shows how your agents are doing across all projects and channels. Pick the period at the top right: 7 days, 30 days or 90 days. Each figure is compared with the period of the same length just before it.
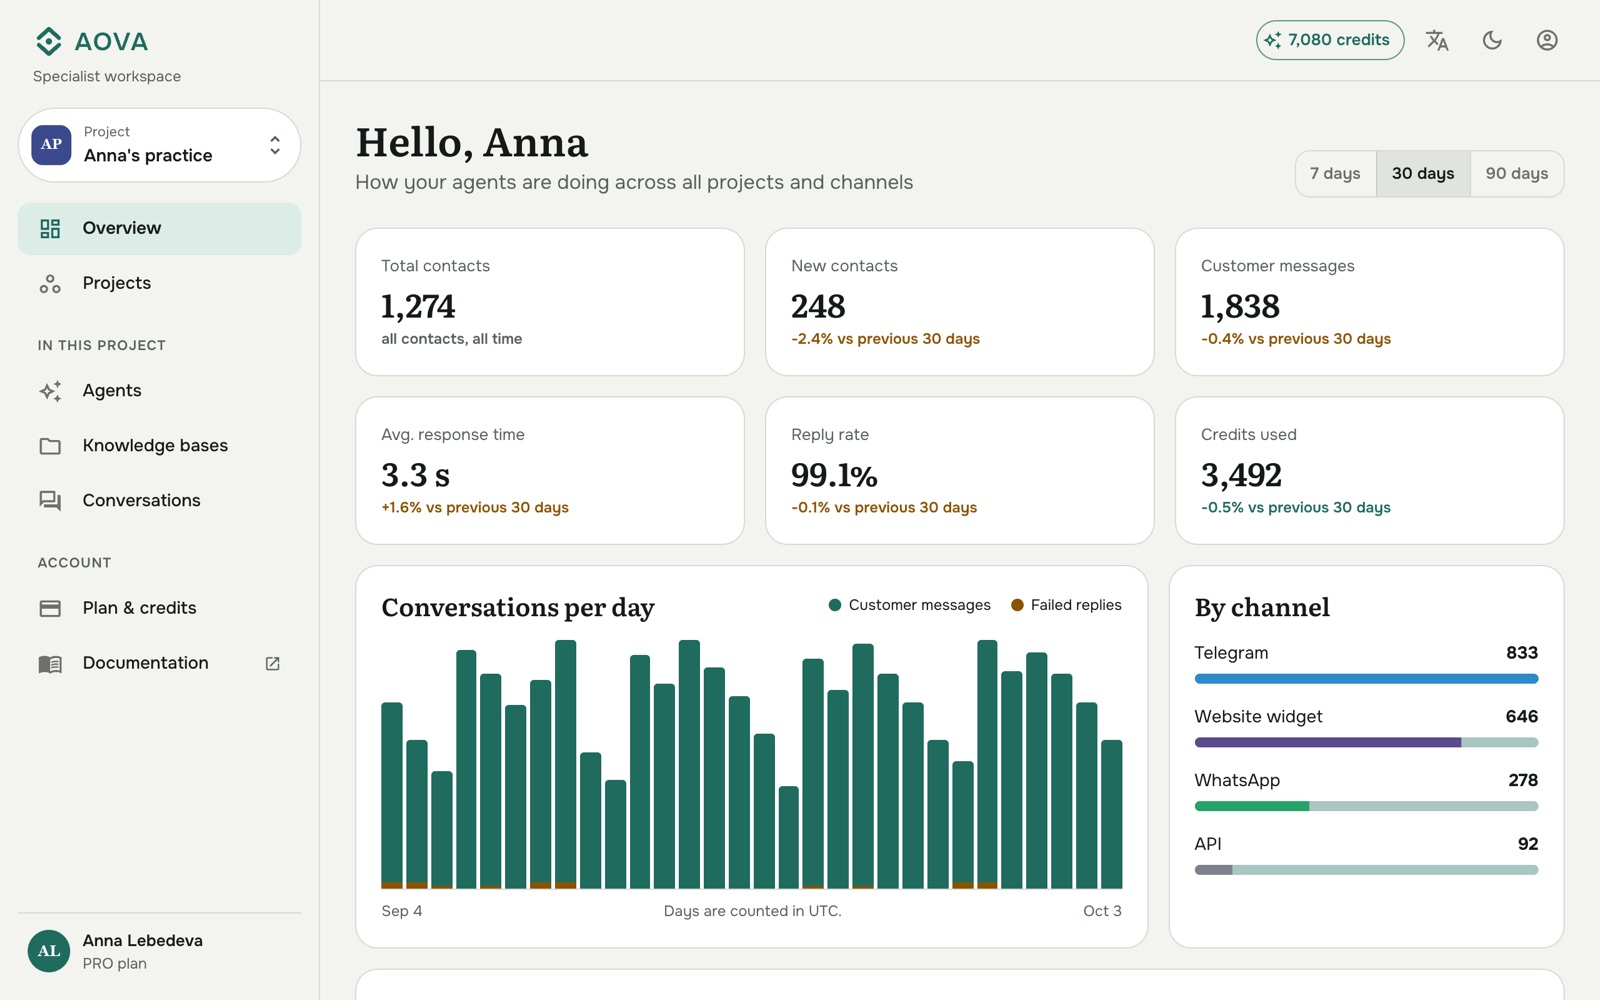
| Figure | What it counts |
|---|---|
| Total contacts | Everyone who has ever written to your agents, all time. |
| New contacts | People who wrote for the first time in the period. |
| Customer messages | Messages clients sent to your agents. Your own test chats aren't counted. |
| Avg. response time | From the moment a client's message arrives until the answer is sent, averaged. |
| Reply rate | The share of client messages the agent answered. Messages that failed (for example because of a channel error) lower it. |
| Credits used | Credits spent on answers and transcription, including test chats. |
Below the figures:
- Conversations per day shows client messages per day, with failed replies marked in a second colour.
- By channel splits client messages by Telegram, website widget, WhatsApp and API.
- Agents ranks your agents by client messages, with their reply rate and response time.
Days are counted in UTC, so a message sent late in the evening in your time zone may count towards the next day. Conversations sent through the chat API without async mode aren't counted.